
How good has the recent U.S. equity rally been? It’s approaching the top of the heap in terms of the magnitude of the move within such a short time frame.
The S&P 500 has surged 25.3 percent since the October 2023 low.
The 22.5 percent rally in Q4 of 2023 and Q1 of this year ranks among the top five percent of the strongest six-month moves in the last 75 years, according to data compiled by Bloomberg Intelligence.
But in the context of the last couple years, the picture is less buoyant, as the chart shows. The S&P 500 is up only 7.6 percent since the January 2022 peak.
The S&P 500 has rallied strongly from its recent lows, but is up only 7.6% since the January 2022 peak
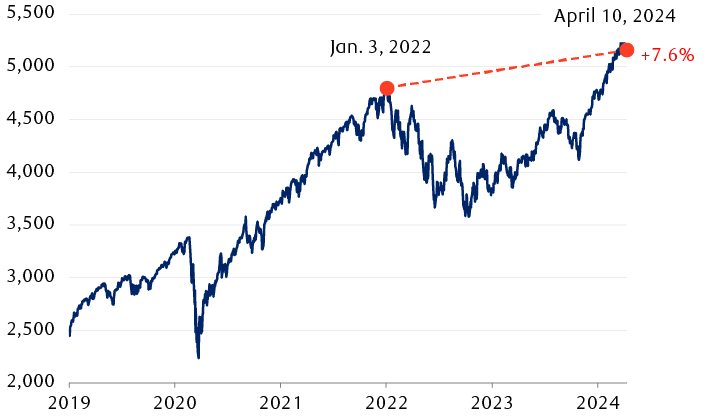
The line chart shows the S&P 500 Index from Jan. 1, 2019 through April 10, 2024. The index began at almost 2,500 and rallied to nearly 3,340 in early 2020. It then quickly plunged to about 2,340 when the COVID-19 crisis hit, bottoming in March of 2020. It subsequently rallied until early January 2022, reaching a peak of almost 4,800. It pulled back to about 3,600 in October 2022. After that it rallied to about 4,600 in July 2023, only to fall back to around 4,100 in October 2023. Since then it has rallied to 5,160 on April 10, 2024.
Source - RBC Wealth Management, Bloomberg; data through 4/10/24
Out of sight, not out of mind
When the market struggled in 2022 and in much of 2023, it was often dogged by inflation fears (and the related significant Fed interest rate hikes and rising Treasury yields) and elevated recession risks. Importantly, earnings growth also declined during part of that period.
For the past six months, those headwinds had largely receded.
The reality is, however, the risks that held back performance in 2022 and 2023 never really went away. The recently released stronger-than-expected consumer inflation data underscores this, in our view.
With the S&P 500 perched near the 5,200 level, we think it’s prudent to keep an eye on three nagging risks:
- Inflation could remain sticky or rise,
- GDP growth could decelerate, and
- The ongoing geopolitical and military clashes in the Middle East and Eastern Europe could widen.
Inflation: The fight’s not finished
RBC Capital Markets points out that the higher-than-consensus March Consumer Price Index (CPI) headline and core data are not the only yellow lights flashing on the inflation front.
Inflation pressures in March were broad. More than half of the items measured within the consumer inflation basket rose. Also, goods prices picked up following an eight-month stretch of month-over-month declines.
The March CPI report, combined with other deteriorating inflation trends earlier this year, prompted RBC Capital Markets to decrease its forecast for Fed interest rate cuts from three 25 basis point (bps) cuts to just one this year, and it thinks it would come in December, after the U.S. presidential election the month before.
RBC Capital Markets still forecasts only two rate cuts next year (one in January, the other in March). In this scenario, the Fed would stop cutting its target interest rate at 4.75 percent—a much higher level than the four previous major rate cut cycles since 1990.
We don’t think the equity market is particularly sensitive to the exact number of rate cuts that the Fed might implement for the remainder of 2024. But should the Fed end up cutting rates by just 75 bps throughout its rate cut cycle as RBC Capital Markets is now forecasting, we think the market would need to adjust because it’s probably currently factoring in more than just three cuts.
GDP: Marginal growth does not have a marginal impact
The Bloomberg consensus forecast for 2024 GDP growth has risen notably, from 0.6 percent in mid-2023 to 2.2 percent currently, and RBC Capital Markets anticipates it can exceed this pace. The well above-trend GDP results from the second half of last year and sturdy underlying employment metrics along with improving manufacturing data so far this year support the notion that 2024 GDP growth could exceed 2.0 percent, in our view.
Annual GDP growth above 2.0 percent corresponds to historical periods of good gains for the S&P 500. The index rose 11.8 percent on a median annual basis when annual GDP growth was between 2.1 percent to 4.0 percent, according to a study by RBC Capital Markets U.S. Equity Strategy.
However, note that when GDP was within a more sluggish 0.1 percent to 2.0 percent zone, equity market performance often stumbled, with the S&P 500 falling 6.6 percent on a median annual basis. Among the four categories of GDP growth that RBC Capital Markets segmented, S&P 500 performance for this category was by far the weakest, as the table at right shows.
S&P 500 returns during different historical GDP growth environments, 1947–2023
Periods of slow GDP growth (0.1%–2.0%) have been the most vulnerable to low returns
| Real GDP growth | Number of years | Median annual return | Range of returns |
|---|---|---|---|
| < 0% | 11 | 23.5% | -29.7% to +45.0% |
| 0.1%–2.0% | 9 | -6.6% | -38.5% to +9.5% |
| 2.1%–4.0% | 30 | 11.8% | -14.3% to +34.1% |
| > 4.1% | 27 | 12.4% | -17.4% to +31.0% |
| All years (1947–2023) | 77 | 10.8% | -38.5% to +45.0% |
Source - RBC Capital Markets U.S. Equity Strategy, RBC Wealth Management, Haver Analytics, Standard & Poor’s; price returns, not including dividends
If GDP growth decelerates meaningfully later this year—a possibility that can’t be ruled out according to our leading economic indicators—we think the equity market could run into some bumpy patches.
As an aside, one might think that the market’s strong historical performance shown in the table above when GDP growth was negative is counterintuitive. But the S&P 500’s median annual gain of 23.5 percent during periods of negative growth actually makes sense when we look a bit further back in time and consider recessionary periods overall. Unlike the other three GDP growth categories, recessionary periods often followed market selloffs, with a median decline of 9.7 percent in preceding years. The market usually declines just ahead of and in the early phase of a recession. And it tends to bottom partway through recessions, before the economic clouds lift, aided by Fed rate cuts.
Geopolitical: Crude connection
Another risk for the market is that the military conflicts in the Middle East and Eastern Europe, and the geopolitical tensions associated with them, could widen.
Equity markets have historically absorbed military clashes and related escalations rather quickly. In the 19 previous key events that occurred since World War II, the S&P 500 fell an average of 6.3 percent, but then traded back up to even in just 29 trading days, on average. However, the market and economy tended to struggle more and for longer when oil prices rose for a sustained period.
Striking a balance
As we stated in our recent assessment of the S&P 500’s earnings potential in 2024, we still see scope for further market gains this year as long as the economy remains resilient without additional negative inflation developments, and the Fed is inclined to cut rates.
When it comes to equity positioning in portfolios, we recommend balancing out the risks associated with inflation staying sticky or reaccelerating and GDP growth decelerating into a sluggish phase, with the possibility that the U.S. economy could sidestep such risks and remain resilient. We would maintain a Market Weight position in U.S. equities.